Logs with full Stacktrace Context


The Sentry SDK for Python is a powerful tool for tracking errors in applications. It simplifies the process of capturing exceptions and sending them to a backend for detailed analysis. Its most powerful feature is the ability to capture full stack traces with local variables when an exception occurs.
I personally use this Sentry SDK a lot… which shouldn’t be surprising, since I’m in the business of building a Sentry-compatible error tracking service with a focus on self-hosting.
However, there are times when you want to log “something interesting” that isn’t quite an error, but still something that’s interesting enough to get the same rich debugging context.
Here’s an example: you might have some code paths that you want to deprecate, but you’re not 100% sure that they’re not being used, or why they were introduced in the first place. You could add a log message to track when these paths are taken. If the full stack trace and local variables were included, understanding how and why the code was called would be much easier.
Another example is when you’re dealing with data that is not fully specified, or is not always as-specified. Setting up a tripwire to log when the data is not as expected can be a powerful debugging tool. But again, without the full context, it can be hard to understand why the data was in that state.
The Goal
Here’s the kind of code we’d like to write:
def deep(number): if number < 0: # when revisiting this code in january 2025, we thought deeply about it and realized that number can never be # negative for _reasons_. However, we're leaving the handling in and put a log-statement to make sure we learn # something if this ever happens. capture_stacktrace("Number is negative; we thought this wouldn't happen but guarded for it anyway") number = 0 return math.sqrt(number)
And here’s how we’d like it to show up, such that we can quickly debug the problem:
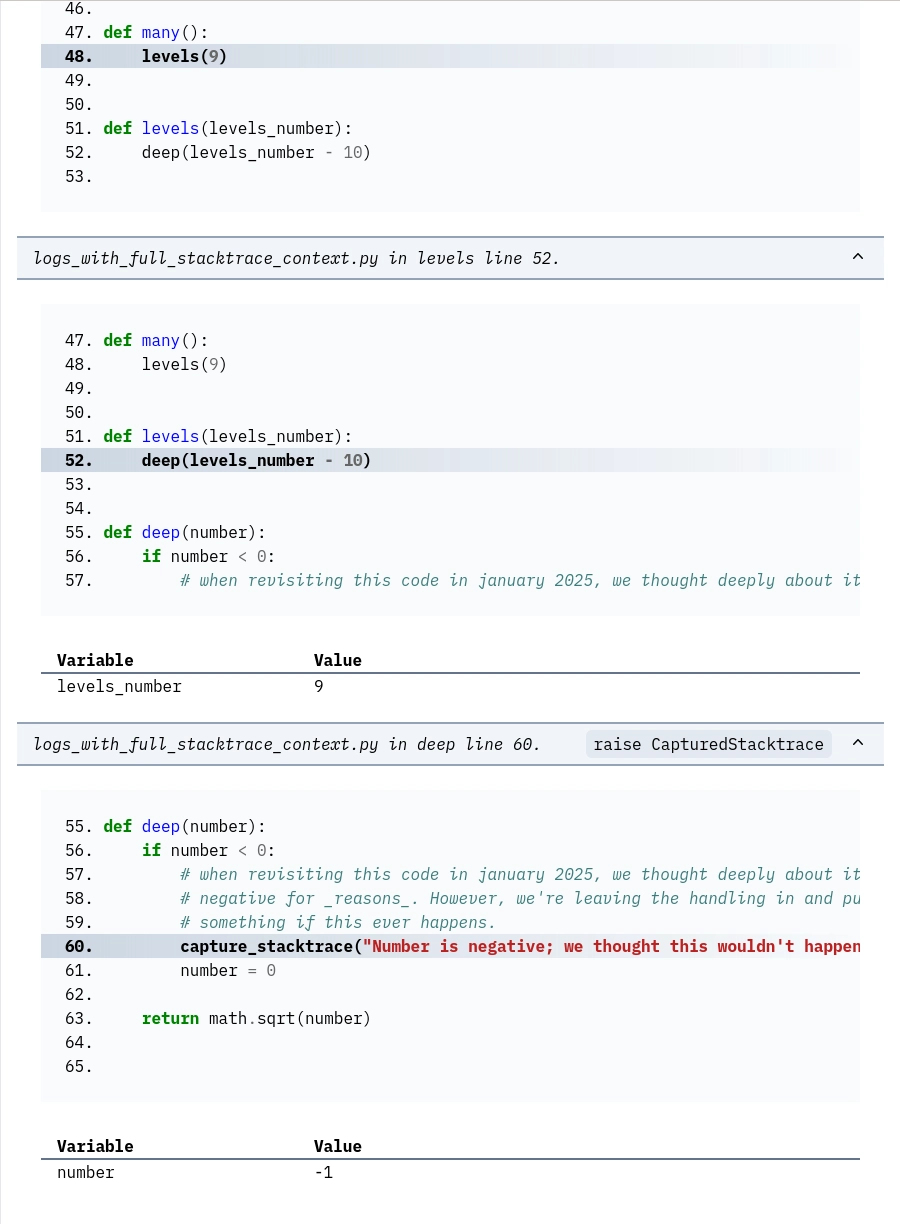
This particular example is a bit contrived, but you get the idea.
Using the stacktrace above, it’s easy to see where the -1 in deep() comes from, where the deep() function was called
from, and where the levels() function was called from.
This makes it much easier to understand the context of the error and debug it.
The Problem
Unfortunately, the Python Sentry SDK doesn’t offer a built-in way to do this.
By default, the SDK supports:
- Sending arbitrary messages with
capture_message, but these don’t include stack traces or local variables. - Sending exceptions with
capture_exception, which includes stack traces but requires raising an exception.
Neither of these options fit the use case of logging arbitrary events while maintaining rich debugging context. I wanted something in between – a way to attach stack traces to log messages directly.
It turns out I wasn’t alone. After I already implemented my solution, I came across a GitHub issue where others described the same need. Unfortunately, the Sentry team’s response was that this feature wasn’t on the roadmap.
The official stance is that users should rely on standard logging mechanisms rather than adding explicit instrumentation to the SDK. Personally, I think that Sentry is missing an opportunity to build one of its most powerful features here.
Solution: An Extension to the Sentry SDK
Since there wasn’t an official solution, I implemented my own extension to the Python Sentry SDK. Here’s the core function:
from sentry_sdk.utils import current_stacktrace import sentry_sdk def capture_stacktrace(message): """ Capture the current stacktrace and send it to Sentry as an CapturedStacktrace with stacktrace context. """ # with capture_internal_exceptions(): commented out "for now" # client_options = sentry_sdk.client.get_options() "not yet" stacktrace = current_stacktrace() stacktrace["frames"].pop() # the present function event = { 'level': 'error', 'exception': { 'values': [{ 'mechanism': { 'type': 'generic', 'handled': True }, 'module': stacktrace["frames"][-1]["module"], 'type': 'CapturedStacktrace', 'value': message, 'stacktrace': stacktrace, }] } } sentry_sdk.capture_event(event)
This function builds an event that looks like an exception but uses a custom message instead. It:
- Captures the current stack trace using
current_stacktracefrom the Sentry SDK. - Removes its own frame to avoid cluttering the trace.
- Constructs an event object mimicking the structure of an exception, including the stack trace and local variables.
- Sends the event to the backend using
capture_event.
Production-readyness
I’ll admit, this is an ad hoc solution. It’s not a generic library feature, and it’s tailored to my needs for debugging with Bugsink. Still, it’s a practical solution that works well for me. Some things to note:
-
I rely on default parameters (i.e. not influenced by any sdk intialization) for capturing stack traces, avoiding complexity and potential maintenance headaches.
-
It’s focused on practicality – just enough to meet the need without over-engineering.
If this blog post gathers enough interest, I might consider turning this into (part of) a proper library. But for now, it’s a simple, effective solution for my use case.
One immediate improvement would be to add a level parameter to the function, allowing the caller to specify the log
level. This would make the function more flexible and useful in a wider range of scenarios (and support one of the key
features as requested in the GitHub issue).
Conclusion
The Python Sentry SDK is a powerful tool for tracking errors in applications. However, it lacks a built-in way to attach stack traces to arbitrary messages. I implemented a simple extension to the SDK that fills this gap, allowing me to log interesting events with rich debugging context.
If you have a similar need, I hope this solution helps you as well. And if you have any ideas for improvements or suggestions for a more generic solution, I’d love to hear them!
Finally, if you’re interested in self-hosting your own error tracking service, check out Bugsink. It’s a Sentry-compatible service that’s easy to set up and maintain, with a focus on privacy and control.