Bugsink vs. AppSignal

AppSignal and Bugsink both help you understand what happened when something goes wrong in production. They approach that problem from very different directions.
AppSignal monitors how your application behaves over time: request traces, database timings, host metrics, logs, and exceptions.
Bugsink focuses on the moment something actually fails: capturing the exception, the stacktrace, and the context needed to fix the bug.
Both tools can show you the same failure. The difference is what they collect, how they run, and how they guide the debugging workflow.
AppSignal Overview
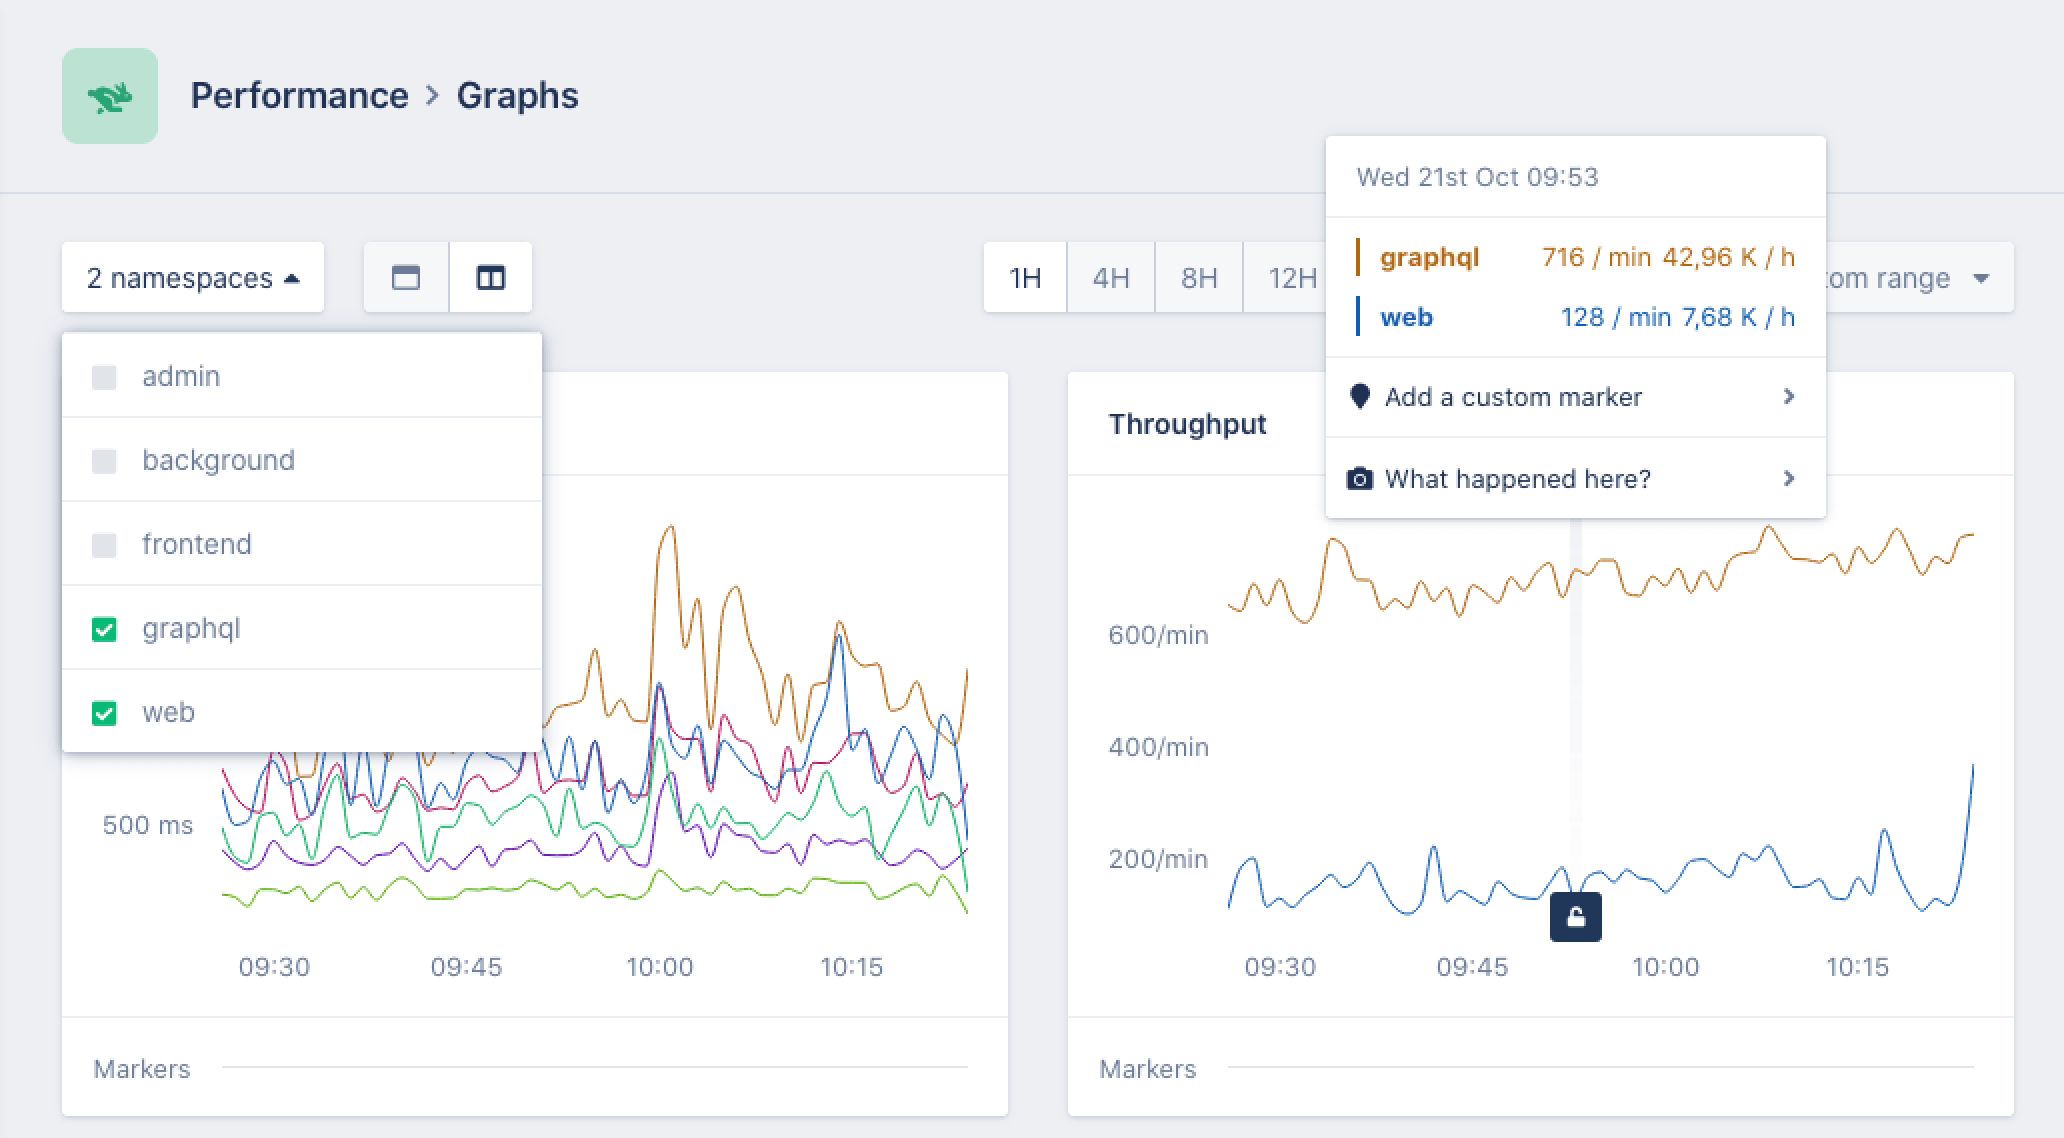
When you run AppSignal in production, it continuously records telemetry about how your application behaves.
Typical signals include:
- Request traces that show how an HTTP request flows through your application.
- Performance metrics such as latency, throughput, and background job duration.
- Database query timings that highlight slow queries.
- Error events when exceptions occur.
- Host metrics like CPU and memory usage.
- Logs and uptime checks that add operational context.
Together these signals form a timeline of what the system was doing. If something becomes slow or unstable, you can inspect traces and metrics to see where time was spent or which component was under pressure.
To collect this information, applications run a language integration that instruments the runtime. The collected telemetry is processed by a native monitoring agent written in Rust, which forwards the data to the AppSignal backend.
Running AppSignal therefore typically involves:
- Language integrations that instrument requests and background jobs.
- A monitoring agent that collects telemetry during execution.
- A hosted backend where traces, metrics, and logs are stored and visualized.
This architecture is typical for modern APM systems. It allows continuous monitoring of application behavior, even when nothing has failed.
AppSignal currently provides integrations for roughly eight backend languages, including Ruby, Node.js, Python, Go, Java, PHP, and Elixir. Most installations send telemetry to the hosted AppSignal service, where the monitoring UI lives.
Pricing follows the same model: AppSignal is primarily billed based on application traffic. As the number of observed requests grows, the monitoring system processes more telemetry and the price tiers increase accordingly. Error tracking is included in those plans, but the cost driver is the overall volume of monitored requests.
Bugsink Overview
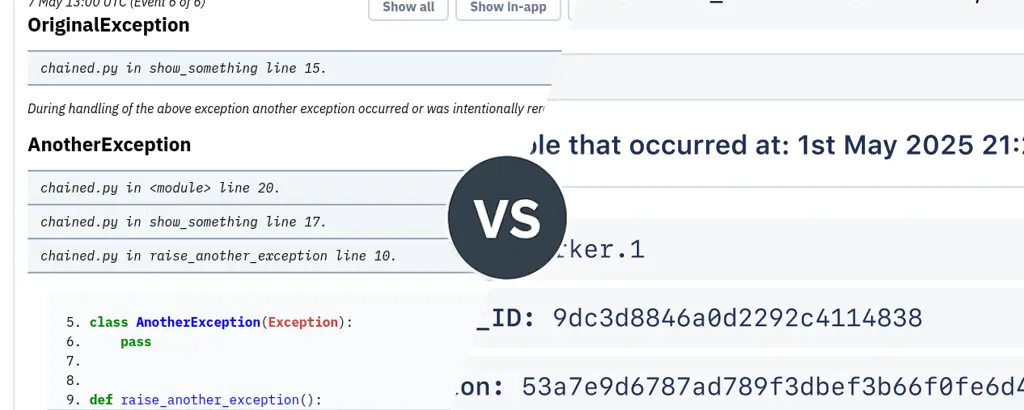
Bugsink starts from a different assumption about debugging production systems: When something breaks, the most valuable signal is usually the exception itself. A raised error tells you exactly what failed and where in the code it happened. That moment already contains the information developers need to start investigating.
Bugsink therefore focuses on error tracking first, capturing as much context as possible when an exception occurs. This approach is described in more detail in the article.
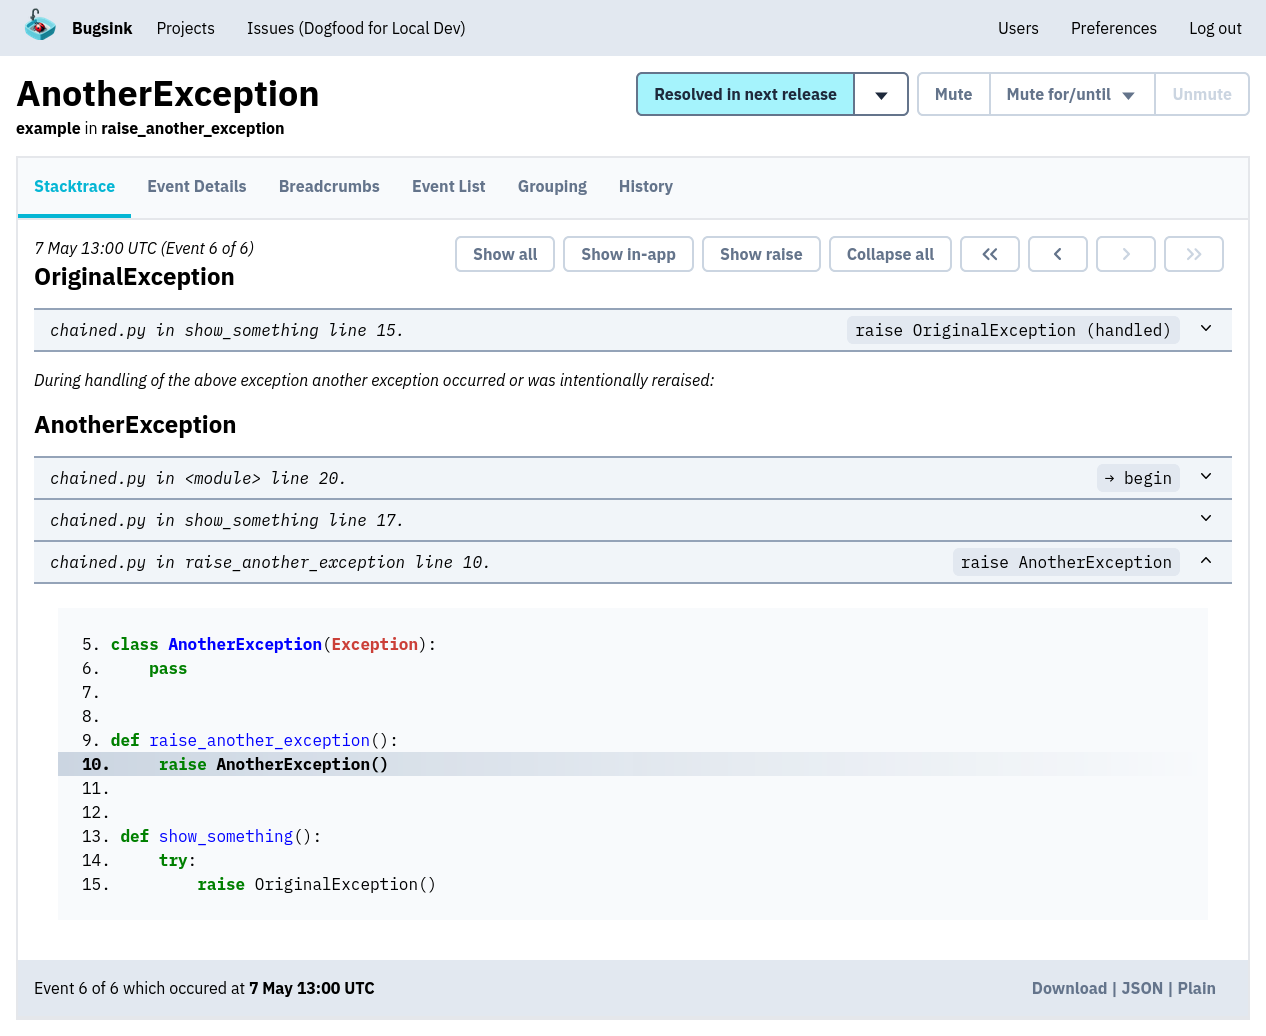
Because Bugsink only collects data when an error happens, each event can contain much richer debugging information:
- Full stacktraces with line numbers and source references.
- Exception chains that show how failures propagated.
- Local variables and request metadata that reveal what the code actually received.
- Environment and user context that explain how the failure occurred.
Instead of spreading attention across every request flowing through the system, Bugsink concentrates on the events that matter most: the ones where the program explicitly reports that something went wrong.
Language Support
AppSignal provides integrations for roughly eight backend languages, each implemented as a dedicated monitoring integration that instruments request handling and background jobs.
Those integrations collect traces, metrics, and error events during execution. The telemetry is then forwarded to the AppSignal backend, where it becomes part of the monitoring dashboards.
Bugsink takes a different route. Instead of maintaining its own SDK ecosystem, it accepts the Sentry event protocol and works with the existing Sentry SDK landscape.
Sentry currently maintains around one hundred SDK integrations across languages and frameworks. These include backend runtimes, browser environments, mobile platforms, and framework-specific integrations.
Because Bugsink accepts the same protocol, those SDKs work without modification. Applications that already report errors to Sentry can typically start sending events to Bugsink by simply changing the DSN.
The practical effect is that Bugsink works with a much broader range of languages and environments than systems that maintain their own monitoring integrations.
Hosting Model
AppSignal and Bugsink also differ in how the monitoring system itself is deployed.
AppSignal follows the typical APM model: instrumentation runs locally, while the monitoring backend runs as a hosted service. Bugsink supports both hosted and self-hosted deployments, using the same SDK integrations and the same workflow in either case.
Being able to choose between those modes — without changing instrumentation or operational workflows — is a strength in itself. Teams can start hosted, move to self-hosting later, or choose either model depending on their environment.
Hosted
With a hosted deployment, Bugsink runs as a managed service. Applications send error events directly to the Bugsink backend, where issues, stacktraces, and debugging context are stored and presented in the UI.
This setup avoids operational overhead. There is no infrastructure to run, no upgrades to manage, and no ingestion pipeline to maintain. The application simply reports errors to the hosted endpoint and developers use the web interface to inspect issues.
For teams that want error tracking without running additional infrastructure, the hosted model keeps the workflow simple while still providing the same error-tracking experience.
Self-Hosted
Bugsink can also run entirely on your own infrastructure.
The system was designed so that this remains practical. Many monitoring platforms rely on telemetry pipelines, background worker clusters, and distributed ingestion systems. Those architectures make sense when the system records every request flowing through an application.
Bugsink focuses on error events, which keeps the ingestion pipeline small. As described in Built to Self-Host, the system runs as a single Django application with minimal infrastructure requirements.
A typical installation looks like this:
docker pull bugsink/bugsink:latest docker run \ -e SECRET_KEY=yCXqi2JscTEA0pztzjFMB5lf4OOFA3JeNujmok6jjrPDgxDiLO \ -e CREATE_SUPERUSER=admin:admin \ -e PORT=8000 \ -p 8000:8000 \ bugsink/bugsink
Upgrades consist of running migrations and restarting the service. There are no telemetry pipelines, worker clusters, or message queues to operate.
Data Collection Model
The biggest architectural difference between the two tools is when they collect information.
AppSignal continuously records telemetry about application behavior:
- Request traces showing how individual requests move through the system.
- Performance metrics such as latency, throughput, and background job duration.
- Infrastructure metrics like CPU and memory usage.
- Logs and error events captured during execution.
Together these signals form a timeline of how the system behaves. When something slows down or behaves unexpectedly, developers typically start by inspecting traces or metrics to locate the problematic component.
Bugsink records only error events, but captures far more information when those failures occur:
- Full stacktraces pointing directly to the failing line of code.
- Exception chains showing how the failure propagated.
- Local variables and request metadata revealing what the code actually received.
- Environment and user context explaining how the failure occurred.
Instead of collecting small amounts of telemetry about every request, Bugsink concentrates on the few moments when the program explicitly reports that something went wrong. Those events are rare but carry the highest debugging signal, which allows Bugsink to store richer context and present it in a UI built around reading and understanding stacktraces.
Independence and Ownership
Today, ownership of infrastructure vendors matters. Laws like the US CLOUD Act allow US authorities to request data from US companies even when stored abroad, which is why many European organizations prefer EU-owned providers.
AppSignal was originally developed in the Netherlands but has been owned by an American company since 2025. Bugsink remains an independent European product, developed and operated without US corporate ownership.
Conclusion
Both tools help developers understand production failures. They simply focus on different parts of the debugging process.
AppSignal is a good fit if:
- Performance monitoring and request tracing are central to your workflow.
- You want a single platform for metrics, logs, traces, and errors.
- Running monitoring as a hosted service fits your environment.
- You want insight into application behavior even when nothing has crashed.
Bugsink is a good fit if:
- Errors are the primary signal you want to track.
- You want deep context for each exception rather than broad telemetry.
- You want the option to run the system hosted or self-hosted.
- Your applications already use Sentry-compatible SDKs.
- You have strict EU data residency requirements.
If you’re exploring alternatives to Sentry or other error tracking tools, you may also want to read: