What Are Sentry Errors?

Modern applications fail in many small ways. A request raises an exception, an API call times out, or a background job crashes. Tools like Sentry collect these failures so developers can see what went wrong in production without digging through logs.
Internally, Sentry represents errors using a small set of concepts. The most important ones are events, issues, stack traces, and the Sentry SDK. An application sends error data through the SDK, Sentry stores each occurrence as an event, and similar events are grouped into issues. Once you understand this model, the Sentry interface starts to make a lot more sense.
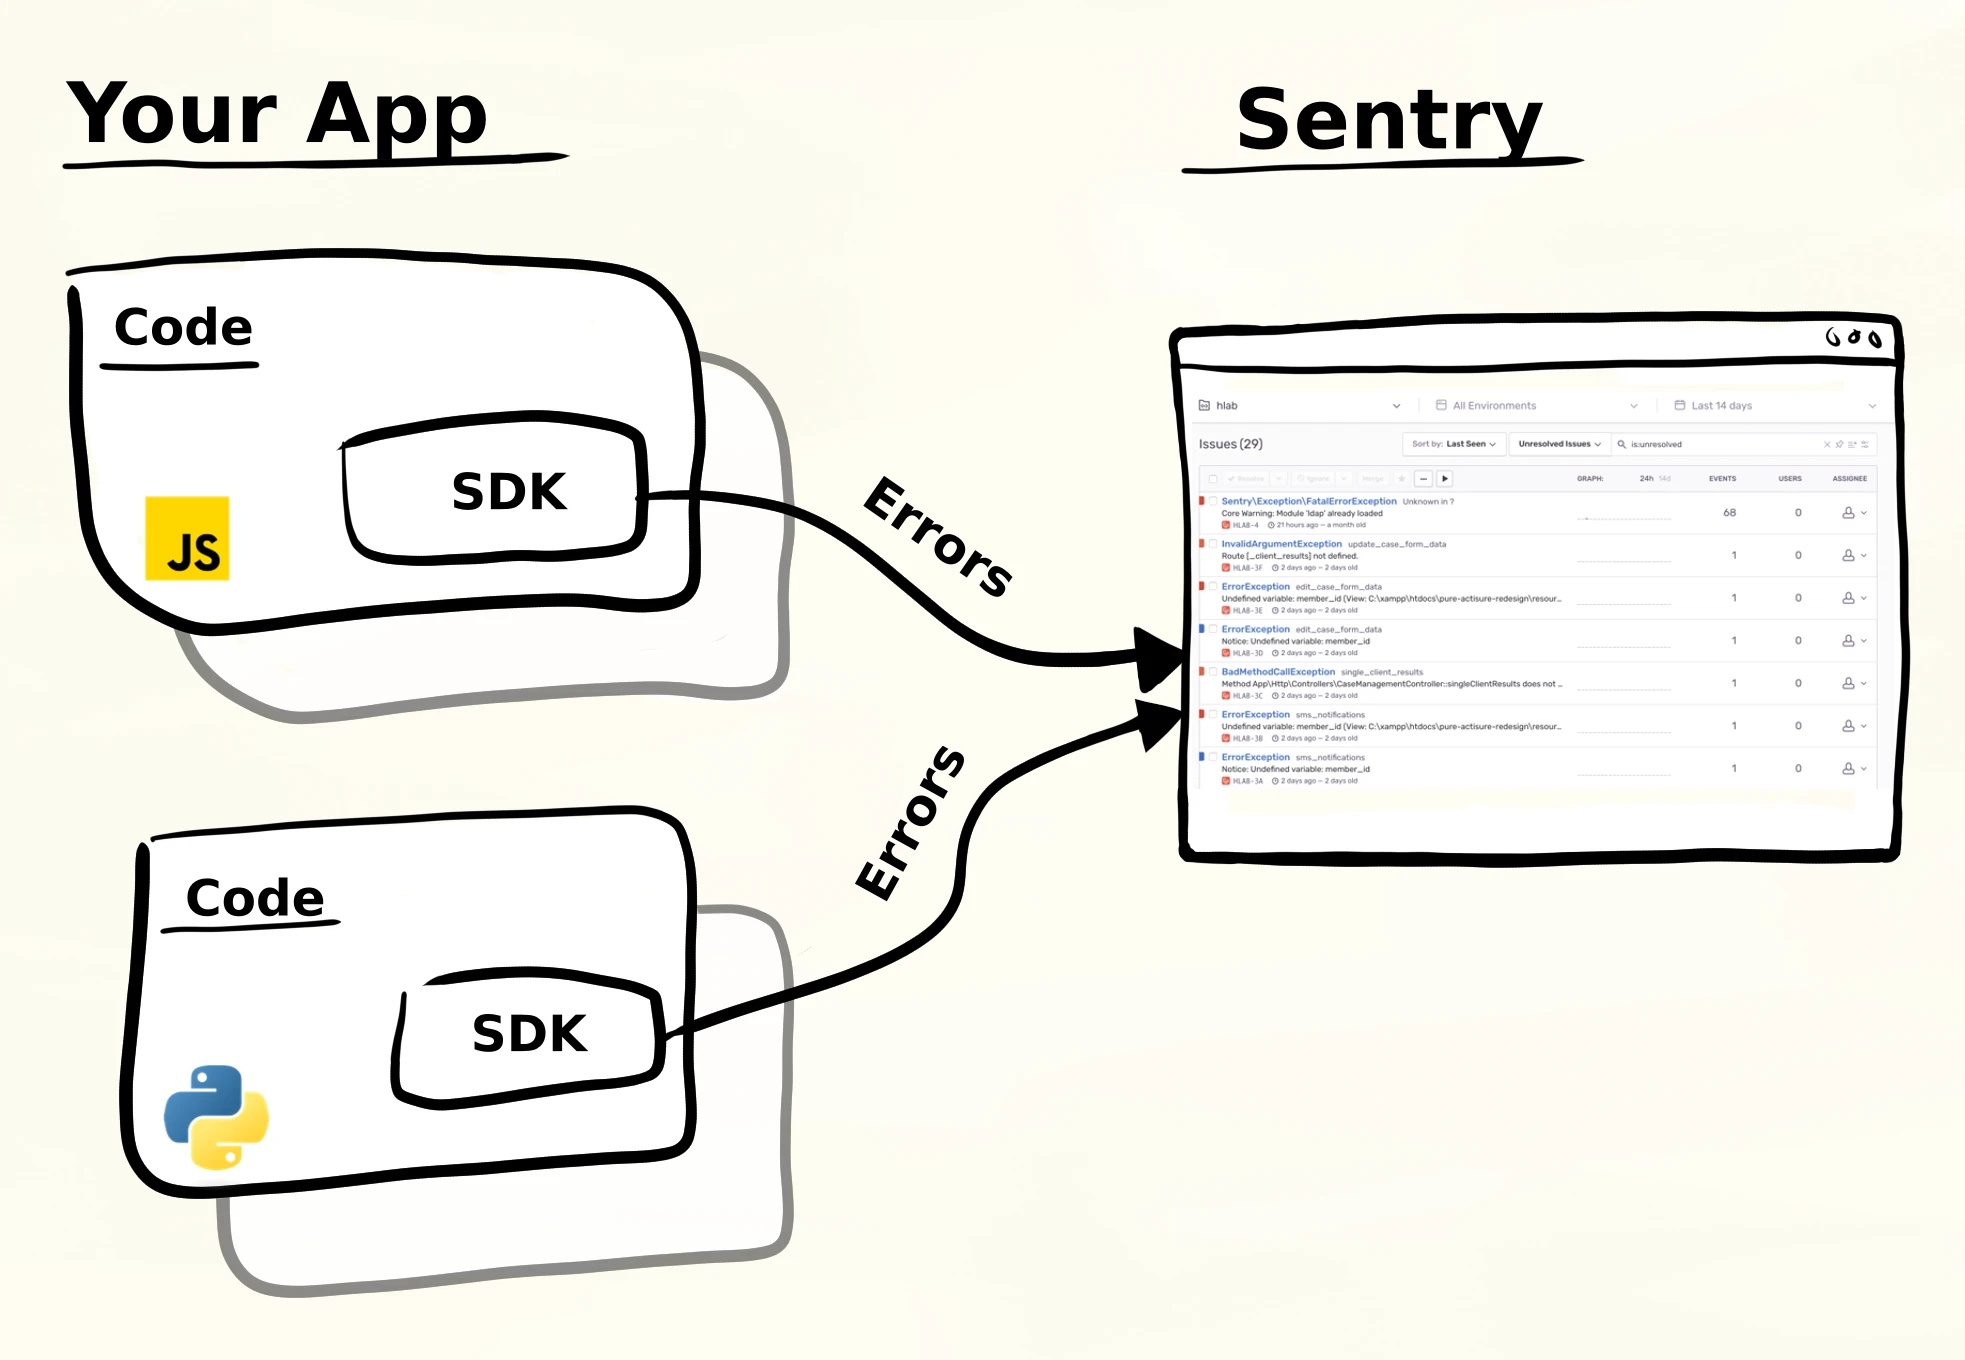
The picture above shows the basic setup. Your application runs code and includes the Sentry SDK. When something fails, the SDK sends an error report to Sentry. This can happen in a frontend application, a Python backend, or any other supported platform. Sentry collects these reports and organizes them so developers can investigate what actually went wrong.
What is a Sentry error?
A Sentry error is an event captured by the Sentry SDK. In most cases this event is triggered by an exception raised inside the application. The SDK intercepts the exception and sends a structured payload to Sentry’s ingestion API, which then stores it for later inspection.
The flow is conceptually simple. An application runs some code and an exception occurs. The Sentry SDK captures the exception and creates a Sentry event. Sentry then analyzes that event and assigns it to a Sentry issue, which represents the underlying bug developers need to fix.
This distinction matters because an error can happen many times. Every time the failure occurs, the SDK sends another event. Developers usually care about the bug itself, not each individual occurrence, which is why Sentry groups events into issues.
Events vs Issues
A Sentry event represents a single occurrence of an error. If one request crashes because of a missing configuration value, that crash generates one event. If the same endpoint fails again five minutes later, that produces another event. Events are therefore the raw reports produced by the running application.
A Sentry issue, on the other hand, represents the underlying problem in the code. Sentry groups events together so developers are not overwhelmed with identical reports. This grouping is mostly based on the Sentry stack trace, which shows the code path where the error occurred, though additional metadata may also influence grouping.
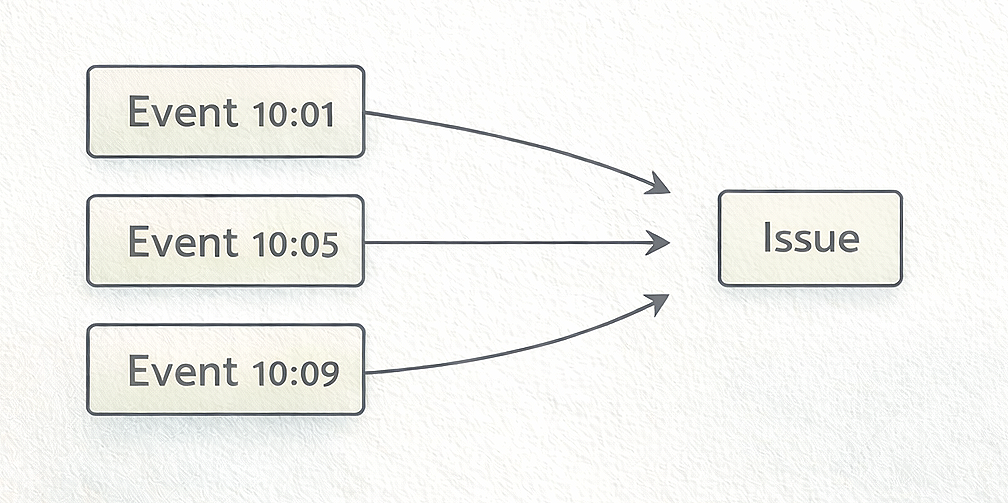
In practice this means that many events may belong to a single issue. The issue represents the bug, while events represent the individual times that bug occurred in production. When you open an issue in Sentry you can inspect the events that belong to it and see how often the problem appears.
What information a Sentry error contains
A Sentry event contains structured debugging data collected by the SDK at the moment the failure occurs. You can think of it as a snapshot of the program state at the time of the error. This information helps developers understand what happened and why.
Stack trace
The Sentry stack trace shows the chain of function calls that led to the error. It typically points directly to the line of code where the exception happened. This is usually the first place developers look when investigating an issue.
Error message
The error message describes the failure itself, such as KeyError: 'user_id' or TypeError: None is not callable.
Together with the stack trace, this usually gives a quick idea of what went wrong.
Environment
Events record the environment where the error occurred, such as production, staging, or development.
This helps distinguish real production failures from test errors.
Tags
Tags are key–value metadata attached to the event. Developers often use tags to identify services, regions, or feature flags. They make it easier to filter and analyze errors later.
Release
The release field indicates which version of the application generated the event. This is particularly useful when a deployment introduces a new bug and you want to see when the failures started.
Breadcrumbs
Breadcrumbs record a sequence of events that happened before the failure. These might include log messages, HTTP requests, or UI actions. They help reconstruct what the application was doing right before the crash.
Request or user context
Many integrations include information about the current request or user. This can help reproduce issues that only occur for certain inputs or specific users.
All of this data together forms a Sentry event. When similar events accumulate, Sentry groups them into a single Sentry issue, which developers can then investigate and resolve.
How Sentry captures errors
Applications integrate Sentry by installing a Sentry SDK. Each language ecosystem has its own SDK implementation, but the core behavior is the same. The SDK hooks into the runtime so it can detect uncaught exceptions and gather debugging information automatically.
A minimal Python example looks like this:
import sentry_sdk sentry_sdk.init(dsn="your_dsn_here") try: 1 / 0 except ZeroDivisionError: raise
When the exception occurs, the Sentry SDK intercepts it and gathers debugging information such as the Sentry stack trace, the exception type, and contextual data. The SDK then sends this information to Sentry’s ingestion API as a Sentry event.
Once the event arrives, Sentry analyzes it and determines which Sentry issue it belongs to. If the stack trace matches an existing issue, the event is grouped with that issue. Otherwise Sentry creates a new issue representing a newly discovered bug.
Tools that track these errors
Sentry is one of the most widely used systems for collecting application errors. It captures failures through the Sentry SDK, stores them as Sentry events, and groups related events into Sentry issues that developers can investigate.
Other error tracking tools exist that follow the same basic model. Many of them accept the same event format produced by the Sentry SDK, which makes it possible to reuse existing instrumentation. The underlying idea is always the same: applications emit structured error reports, those reports are stored as events, and events are grouped into issues that represent real bugs.
One example is Bugsink, which is compatible with existing Sentry SDKs and focuses strictly on error tracking rather than broader observability features. The goal is simply to capture exceptions, store events, and present issues in a way that makes debugging straightforward.
If you’re evaluating alternatives or trying to reduce Sentry costs, see the article on Saving Costs on Sentry. Regardless of the tool you use, the concepts remain the same: applications emit events when failures occur, those events include stack traces and context, and similar events are grouped into issues so developers can find and fix bugs.