Error Tracking
When something crashes, your stacktrace shows where execution went wrong and how it got there.
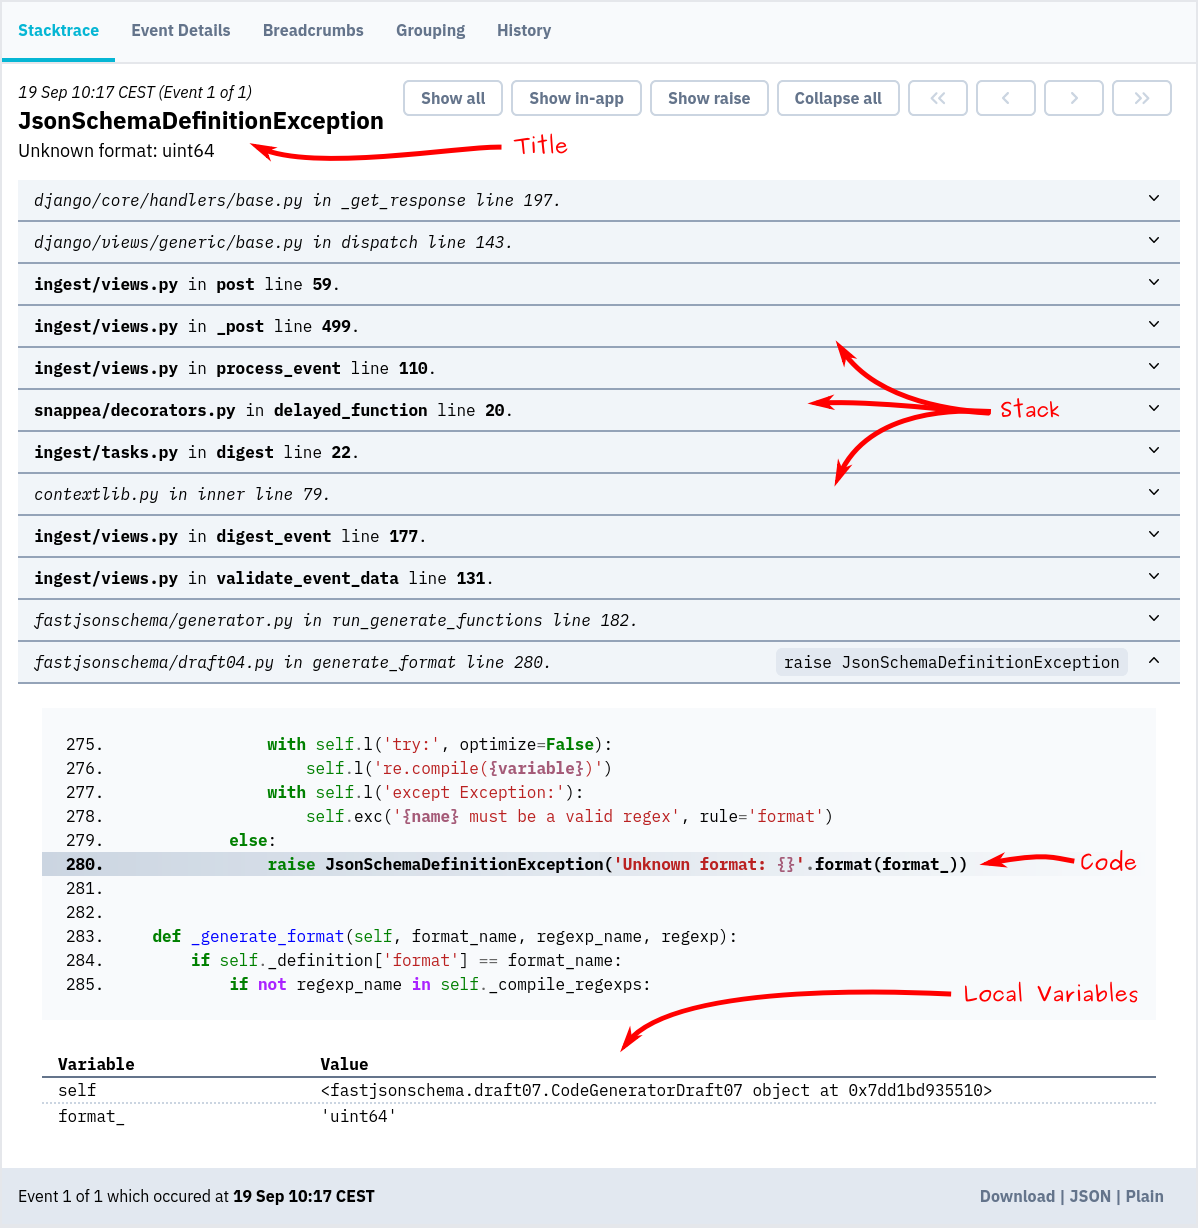
In Bugsink, the stacktrace is the center of the interface and the first thing you see. It gives you the full call stack, code, and local variable values. Everything you need to understand and fix the problem quickly:
Some key principles:
-
Simple & clean: The stacktrace is shown at the top of the page, so it’s the first thing you see. The format is clear, highlighting what matters. In-app frames and library frames are separated to help you focus.
-
Complete: No information is hidden by default. You get the full picture up front: no need to click around or expand hidden sections.
-
Local variables: You see the values that variables actually held at the time of the error. This makes it easier to understand the context and spot the problem.
Stacktraces are the core of debugging. They show you exactly where the error occurred and how your code got there. With that information, you can jump straight into fixing it.
For a more opinionated take on why stacktraces matter, check out our blog post which hit the Hacker News front page recently.
Alerts
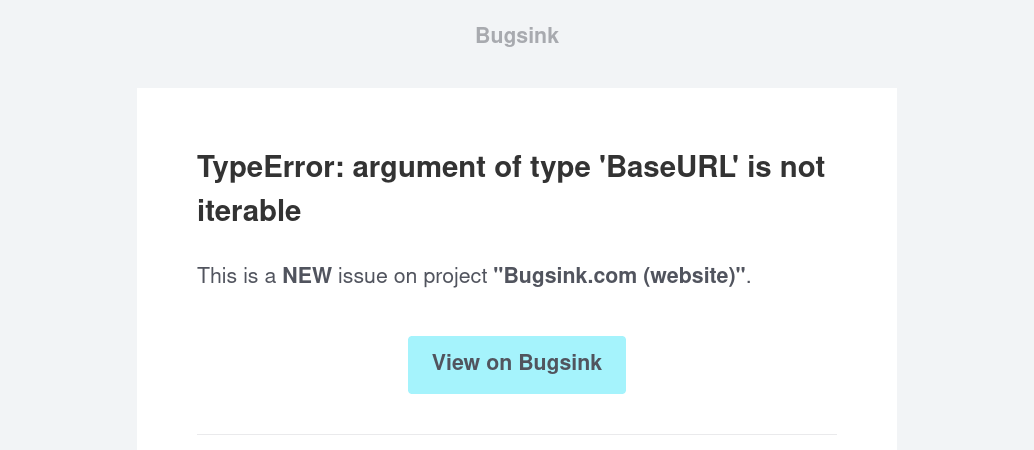
Bugsink alerts you when something breaks — no need to wait for a user report. Alerts cover:
- New issues: Something broke for the first time.
- Regressions: An issue that you thought you fixed is back.
- Unmuted issues: You silenced an alert until some time in the future, and now it’s that time.
Alert channels
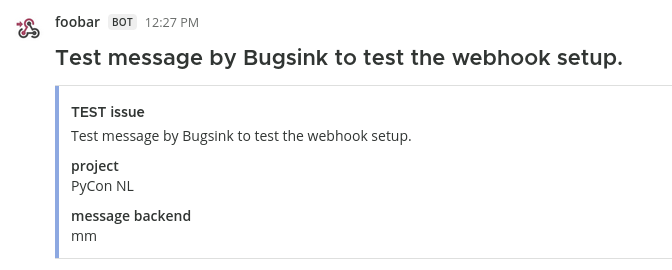
Alerts are delivered via your preferred channel:
- Slack, Mattermost, and Discord integrations are available today.
- Telegram and Microsoft Teams integrations are in active development.
- Email works out of the box and acts as a reliable fallback.
Webhook-based chat alerts also support outbound destination validation and allow/deny controls. For the details, see Webhook Outbound Policy.
Alerts give you a direct signal when an issue occurs, tied to a specific stacktrace and issue.
If a new bug slips into production, you’ll hear about it the moment it happens, often before anyone reports it. And because error events are grouped into issues, you get one clear alert per problem, not a flood of noise.
→ Alerts Docs. → Webhook Outbound Policy.
Grouping into Issues
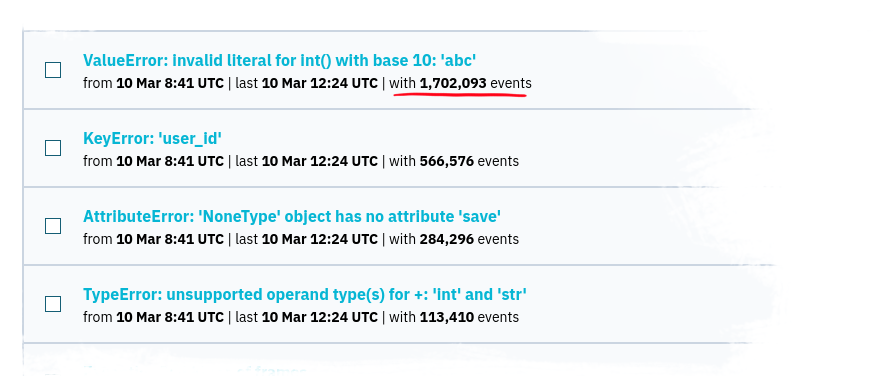
Seeing the same error repeated hundreds of times doesn’t help. Bugsink groups related errors automatically, turning a flood of events into a manageable list of problems to fix:
- One cause, one issue: Similar errors are grouped based on key attributes like type, message, and context.
- Less noise: Instead of hundreds of events, you get a single issue to investigate.
Whether it’s an exception or a log message, Bugsink looks at what matters — the structure, content, and origin — to group things that belong together. The defaults work well for most projects, but you can fine-tune them if needed.
Issue status
Bugsink tracks the status of each issue, so you know what needs attention and what’s already handled. You can set an issue’s status to:
- Resolved: mark an issue as fixed, optionally tied to a specific release.
- Resolved in next release: the fix is done but not deployed yet. Events may still occur, but they won’t trigger new alerts while you’re waiting for the rollout.
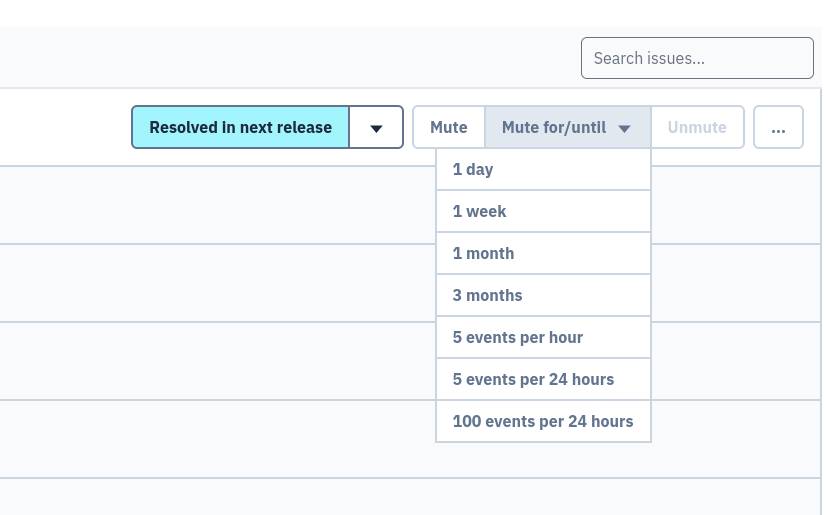
- Muted: suppress alerts for issues you’re intentionally not acting on.
Muting can be time-based (for example, mute for a week) or conditional (for example, alert only if more than 5 events per day occur), so background noise stays quiet while real problems still surface.
If an issue occurs again after the release it was resolved in, Bugsink treats it as a regression and alerts you accordingly. This way, you can be confident that fixes stay fixed.
Further Details
The issue view focuses on the stacktrace. From there, you can drill down into a second page with the full event payload.
This page shows all additional data sent by the SDK: request information, headers, environment, runtime details, and custom context. Nothing is collapsed or summarized away.
Request information is shown in full. For web applications, this often provides the context needed to reproduce or explain an error.
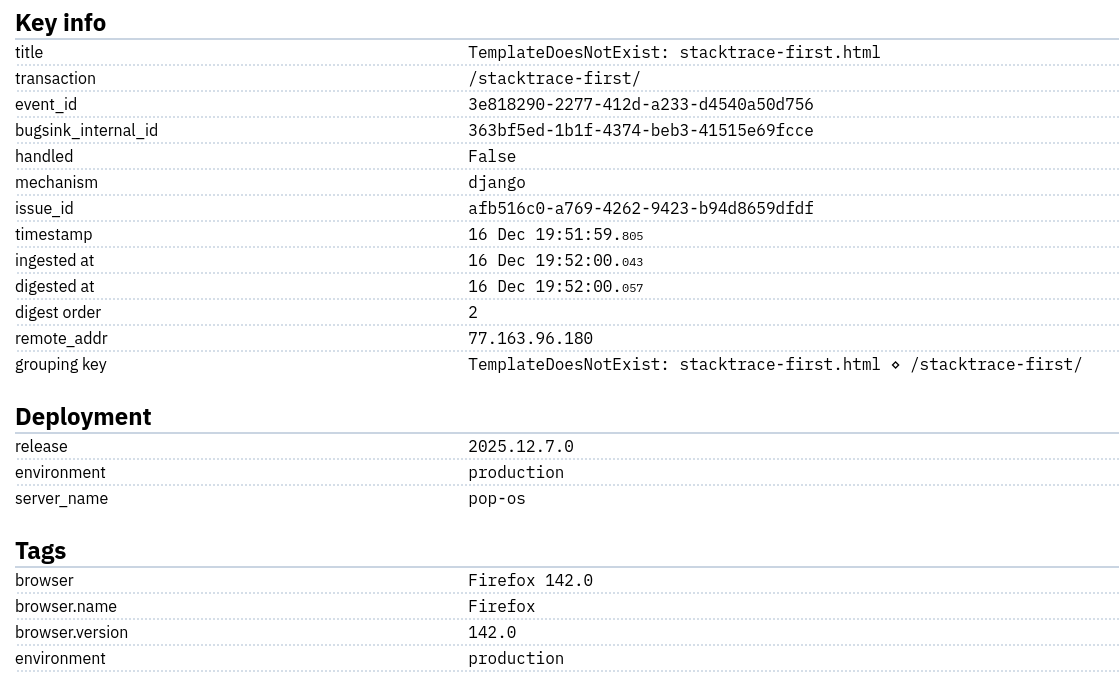
Tags
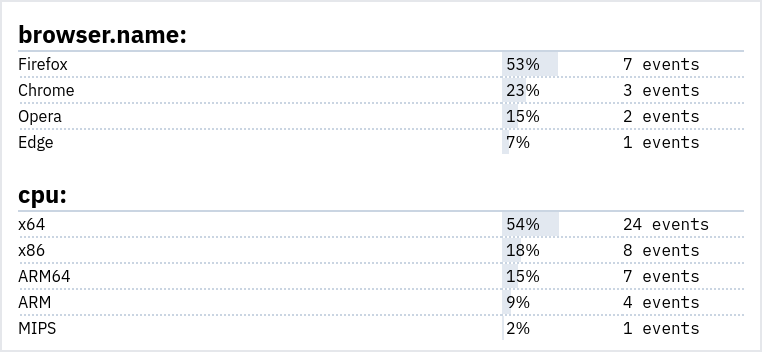
From the issue view, you can also open the tag breakdown.
Tags show how an issue distributes across dimensions such as release, environment, user, or custom application labels. Values and event counts are shown directly.